Groundwater hydrologists use the
Cooper and Jacob (1946) solution to determine the aquifer properties of a nonleaky confined aquifer using drawdowns measured during a constant-rate pumping test. The approximate method of Cooper and Jacob derives from the
Theis (1935) type-curve method when the variable u in the Theis well function, w(u), is sufficiently small (i.e., time is large or radius is small).
AQTESOLV has built-in tools to check the validity of analyses performed with the Cooper and Jacob method and to assist you with
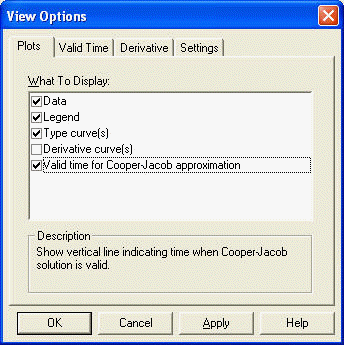
visual curve matching. First, you can superimpose on your plot the time when u is less than a critical value. Choose
View>Options>Plots tab and check the option for
Valid time for Cooper-Jacob approximation (Figure 1).
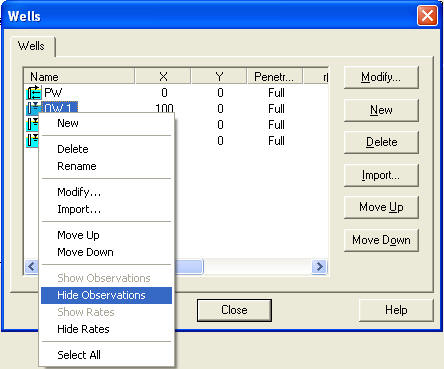
 |
| Figure 1. Check option to display valid time for Cooper and Jacob solution. |
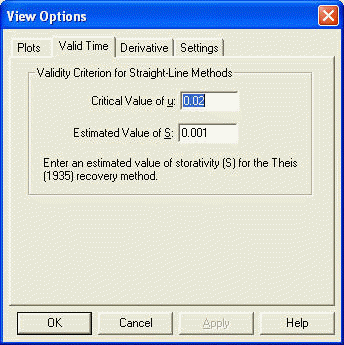
Click the
Valid Time tab to set the
critical value of u (Figure 2). A critical value between 0.01 and 0.05 is typical.
 |
| Figure 2. Set critical value of u used to check validity of Cooper and Jacob approximation. |
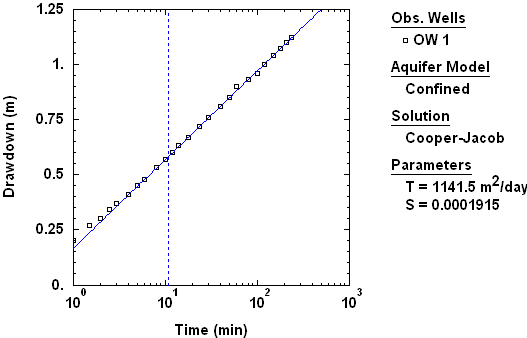
When you activate the valid time option, a
dashed vertical line appears on your time-drawdown or composite plot to indicate the time when the Cooper and Jacob approximation meets the critical value of u (Figure 3). The position of the vertical line is a function of T (transmissivity) and S (storage coefficient) as well as radial distance between the pumping and observation wells..
 |
| Figure 3. Cooper and Jacob method (blue line) matched to time-drawdown data from constant-rate pumping test (data from Todd 1980). Dashed vertical line indicates time when Cooper and Jacob approximation becomes valid. |
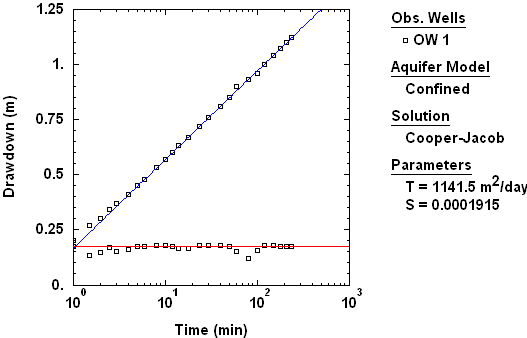
The second way that you may evaluate the proper application of the Cooper and Jacob method using
AQTESOLV is through
derivative analysis. After superimposing the derivative on your semilog plot of drawdown versus time, match the Cooper and Jacob straight line to drawdowns corresponding to the
derivative plateau, i.e., during the period of
infinite-acting radial flow (Figure 4).
 |
| Figure 4. Cooper and Jacob method (blue line) matched to drawdown data during period of infinite-acting radial flow when derivative reaches plateau (red line). |
Use these two techniques to obtain more reliable results when using the
Cooper and Jacob method. Get
AQTESOLV and start applying these powerful tools in
your next
pumping test interpretation!
Visit the
AQTESOLV Knowledge Base to find more tips on the using the software. The
AQTESOLV documentation also includes a number of examples illustrating the use of the
Cooper and Jacob straight-line method.
We invite you to follow HydroSOLVE on
LinkedIn and
Google+!