Wednesday, November 14, 2012

AQTESOLV Voted #1 Software In Poll

What is the best pumping test analysis software? Groundwater professionals, responding to a recent poll on LinkedIn, overwhelmingly chose AQTESOLV as their preferred software for pumping test analysis.[pdf]
Results of LinkedIn poll, "What's your preferred pumping test software?"
Here's just a sample of comments posted by participants in the pumping test software poll:
  • "AQTESOLV [has] a great solution set with real flexibility."
  • "AQTESOLV is not only a great solution but is user friendly and has great customer support that comes along with it."
  • "AQTESOLV is the industry's standard. Glenn D[uffield] does a great job with continuing updating and improving an already superb product."
  • "AQTESOLV is a fantastic tool. Easy to use, informative help documentation, and great customer support."
  • "Totally agree with the other commenters [regarding AQTESOLV]. Glenn [Duffield] has built a wonderful product that is both powerful and user-friendly. Oh, and speaking of friendly, if a person has a question about the software, Glenn is very quick to provide help, either by phone or email. Great product, great customer service. What more could you want?"
Thanks to everyone who voted in the poll and for all of the kind words!

Monday, July 9, 2012

Catalog of Derivative Plots

Derivative analysis is a powerful diagnostic technique for the interpretation of data from pumping tests. Use of the derivative in pumping test analysis can highlight many flow regime features that otherwise may be hard to discover when inspecting drawdown data alone.

A catalog of derivative plots, showing the theoretical drawdown and derivative signatures on log-log axes for different flow regimes, is a useful reference to the practicing hydrogeologist when performing derivative analysis. For example, Figure 1 shows the drawdown and derivative response for a finite-diameter pumping well with wellbore storage in an infinite nonleaky confined aquifer.

Figure 1. Wellbore storage flow regime, infinite nonleaky confined aquifer.
One observes the wellbore storage flow regime at early time when the drawdown and derivative curves both exhibit unit (1:1) slopes (Figure 1). Radial flow in an infinite-acting aquifer shows up as a plateau on the derivative response.

An extensive catalog of derivative plots is available at the Aquifer Testing 101 section of the AQTESOLV web site to help you with derivative analysis. Use the catalog to become familiar with the derivative plot signatures for various well/aquifer geometries corresponding to different flow regimes.

Sunday, June 24, 2012

Importance of Smoothing Derivative Data

Derivative analysis is a powerful diagnostic tool that enhances the interpretation of pumping test data. Hydrogeologists use the technique to identify flow regimes, discern boundary conditions and refine the selection of aquifer models.

Derivatives are not measured directly in the field; rather, they are computed by numerical differentiation from drawdowns collected during a pumping test. Straightforward calculation of the derivative from neighboring drawdown measurements typically leads to noisy derivative data. Therefore, smoothing routines are employed to obtain a cleaner derivative signal (Bourdet et al. 1989; Spane and Wurstner 1993).

To appreciate the importance of derivative smoothing, consider field data measured in a deep piezometer during a constant-rate pumping test performed in an unconfined aquifer (Kruseman and de Ridder 1994). Figure 1 is a derivative plot for the piezometer showing drawdown (squares) and derivatives (crosses) computed without smoothing (nearest neighbor method). Without smoothing, the derivative data provide little useful information for the interpretation of this test.

Figure 1. Derivative plot showing derivatives computed without smoothing.
Application of the Bourdet method to smooth the derivatives leads to a derivative plot with useful information (Figure 2). The trough in the derivative curve shown in Figure 2 is typical for an unconfined aquifer with delayed yield. The derivative signature suggests the possibility of using a mathematical model by Neuman (1974) to interpret the data.

Figure 2. Derivative plot showing derivatives computed with Bourdet smoothing.
AQTESOLV features three smoothing methods for computing derivatives including the Bourdet and Spane methods.

More information on derivative analysis is available at Aquifer Testing 101.

Tuesday, June 19, 2012

Hydraulics of Wells

Hydraulics of Wells by M. S. Hantush (1964) is available for download. This classic work is a recommended reference for the bookshelf of every practicing hydrogeologist.

To find more aquifer testing materials including other links to downloadable resources, check out my reference list at the Aquifer Testing 101 web site.

Wednesday, March 21, 2012

Three-Day Aquifer Testing Course in Baltimore

I'm very excited about the upcoming aquifer testing course entitled Advanced Aquifer Testing Techniques Featuring AQTESOLV: New Concepts, Field Methods and Data Analysis Procedures to be held in Baltimore, Maryland, USA on April 24-26, 2012. It's the first time that we've offered the three-day course in the USA since 2009.

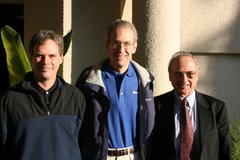
The instructors at this year's course will include Dr. Jim Butler of the Kansas Geological Survey, Dr. Shlomo Neuman of the University of Arizona and myself. Dr. Butler is well known for his essential book The Design, Performance and Analysis of Slug Tests as well as numerous papers on pumping tests and slug tests. Dr. Neuman, who will be a special guest instructor at the course, is acclaimed for his important contributions to the published literature on the interpretation of pumping tests in unconfined and leaky confined aquifers. I'll be on hand to give personalized instruction on the use of AQTESOLV.

We'll be holding the course at the Camden Yards Conference Event Center in Baltimore's very attractive Inner Harbor area. Camden Yards is the highly regarded ballpark of the Baltimore Orioles; as a bonus, course participants will have a special opportunity to attend an evening baseball game on Day 2 of the course.

For more information and to register for the course, please visit the Midwest Geosciences web site. I hope that you can join us!