Showing posts with label prediction. Show all posts

Wednesday, November 13, 2013

Intermittent Pumping

One of the many applications for the variable pumping rate option in AQTESOLV is to simulate drawdown resulting from intermittent pumping in one or more pumping wells. Use this feature for pumping test interpretation or drawdown modeling.

In the following figure, AQTESOLV predicts drawdown due to an irrigation well extracting water from a nonleaky confined aquifer with daily on/off cycles extending over a growing season of 245 days. During each pumping cycle, the well withdraws groundwater at 220 gallons-per-minute (gpm) for 12 hours followed by 12 hours of recovery. At the end of the growing season, all pumping stops and sustained recovery begins. Drawdown in the pumping well (blue line) clearly shows the cycles of intermittent pumping; whereas the two observation wells (red lines) located 500 and 2000 ft from the extraction well demonstrate how the cyclic drawdown response dissipates with distance.
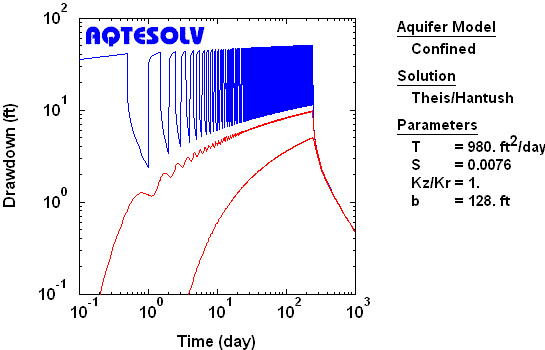
Drawdown due to intermittent (cyclic) pumping in a nonleaky confined aquifer.
Entering a lot of pumping cycles by hand can be tedious, so AQTESOLV makes the task easy for you. One method is to prepare the cyclic rate history in Excel and copy/paste the rates from Excel into AQTESOLV. Alternatively, you may enter just one cycle into AQTESOLV and have the software repeat the cycle a specified number of times (find details in the AQTESOLV manual).

If your primary interest is the average drawdown at relatively distant observation wells over long periods of intermittent pumping, it is often sufficient to assume a constant average pumping rate. The following figure shows the predicted drawdown for a well extracting at 110 gpm over the same 245-day growing season as the previous intermittent pumping scenario.
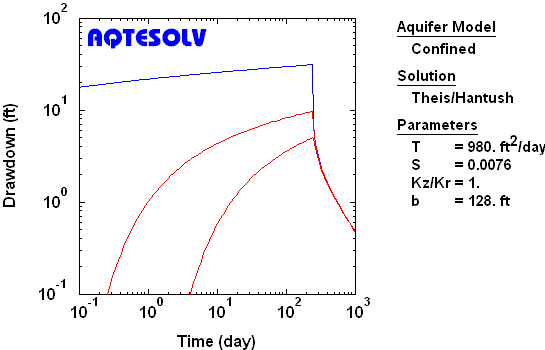
Drawdown assuming average pumping rate in a nonleaky confined aquifer.
The two preceding examples applied the Theis (1935) nonequilibrium solution to predict drawdown under intermittent pumping conditions in a nonleaky confined aquifer of infinite extent; however, you may use virtually any of the pumping test solutions in AQTESOLV to forecast drawdown for constant- or variable-rate pumping in nonleaky confined, leaky confined, unconfined or fractured aquifers. Plus, AQTESOLV allows you to add no-flow or constant-head boundaries to model surface water boundaries and limited aquifers as required.

Sunday, November 1, 2009

Groundwater Mounding

Upon its release in 2006, AQTESOLV/Pro v4.0 became the first aquifer testing software to feature groundwater mounding calculators that predict the transient rise and decay of the water table beneath rectangular and circular recharge areas (Hantush 1967). Using AQTESOLV, you may compute the maximum rise of the water table and generate contours of a groundwater mound with ease.

The example plot (above) shows a 3-D contour plot of a groundwater mound developed around a hypothetical rectangular recharge area. Applications for the groundwater mounding calculators in AQTESOLV include infiltration from septic systems and recharge from stormwater impoundments.

Visit the AQTESOLV web site for more information on the Hantush (1967) solutions for groundwater mounding prediction.

Monday, December 31, 2007

Wellfield Simulations

This will be my last post for 2007, so let me begin by expressing my sincere appreciation and gratitude to all of you who have either become new AQTESOLV customers or continued to support the software by upgrading in the past year. As always I'm working hard to add new features that will maintain AQTESOLV's status as the leading software for aquifer test analysis.

As many of you already know, AQTESOLV includes the capability to model more than one pumping well in either pumping test analyses or predictive simulations. You may enter a variable pumping rate schedule for each well. For example, you can use the multiple pumping well feature to predict total drawdown in a wellfield as shown in the contour plot.

Another use of this multi-well feature would be to include the effect of more than one pumping well in the analysis of a pumping test (e.g., a domestic well that turns on and off during your test). Image wells can be simulated in the same way.

Best wishes for a happy and healthy New Year!