AQTESOLV allows you to analyze pumping tests with more than one observation well. For example, Figure 1 shows the interpretation of drawdown data recorded in the pumped well and three observations wells during a
constant-rate pumping test conducted in a nonleaky confined channel aquifer (near Estevan, Saskatchewan, Canada).
 |
| Figure 1. Constant-rate pumping test in nonleaky confined channel aquifer (Walton 1970). |
Prior to late-time
boundary effects, one observes infinite-acting aquifer conditions in the drawdown response at all wells (Figure 1).
Analysis of multiple observation wells is not limited to nonleaky confined aquifers. In the following figure, we see the analysis of drawdown data from a constant-rate pumping test in a leaky confined aquifer with three observation wells.
 |
| Figure 2. Constant-rate pumping test in leaky confined aquifer (USBR 1995). |
Interpretation of this test uses the
Hantush and Jacob (1955) method for a leaky confined aquifer with incompressible aquitard(s). Prior to the onset of leakage, the aquifer behaves like a nonleaky confined aquifer of infinite extent as shown in Figure 2 by the superimposed
Theis (1935) solution (red curve).
We can use
AQTESOLV to analyze multi-well tests in phreatic aquifers, too. For example, two fully penetrating observation wells are used for the interpretation of a constant-rate pumping test in an unconfined aquifer with delayed yield near Gironde, France (Figure 3).
 |
| Figure 3. Constant-rate pumping test in unconfined aquifer with delayed yield (Neuman 1975). |
Analysis in the example above is performed with the
Neuman (1974) method for an anisotropic water-table aquifer with delayed gravity response; one can see from the composite plot how the shape of the drawdown response is affected by radial distance from the pumping well (Figure 3).
Figure 4 shows the interpretation of a multi-well constant-rate pumping test in a double-porosity fractured aquifer using a solution by
Moench (1984).
 |
| Figure 4. Constant-rate pumping test in double-porosity fractured aquifer (Moench 1984). |
In the example above, the blue curve on the composite plot shows the fit to drawdown data from the pumped well while the red curve is matched to observation well data.
In each of the preceding examples,
one set of aquifer properties was used to match drawdown data from
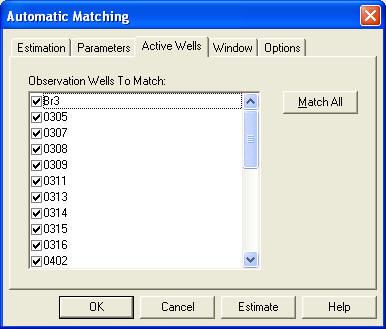
all observation wells in a data set. At times, however, you may wish to match only a few wells by themselves. You may accomplish this task using either
visual or
automatic curve matching in
AQTESOLV.
Sometimes you start out with only one or two observation wells in a data set and wish to add more wells later. Adding observation wells is easy with
AQTESOLV. Choose
Wells from the
Edit menu and click
New to enter data for a new well.
To find worked examples of pumping tests with multiple observation wells, check out the
AQTESOLV Help file/manual or visit the
Application Gallery at the
AQTESOLV web site.