When using
AQTESOLV to perform
visual curve matching on a data set with multiple observation wells, it's often useful to turn off the display of one or more wells and focus your attention on the remaining wells.
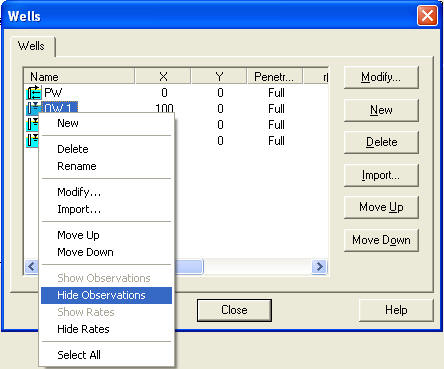
To hide observation data for particular wells, choose
Edit>Wells and select the wells in the list that you'd like to hide. Right click over the selection and choose
Hide Observations.
To turn on the display of hidden observations wells, select the wells to display, right click over the selection and choose
Show Observations.
Find more
tips on the
AQTESOLV website!
Follow
AQTESOLV on
LinkedIn and
Google+!


No comments:
Post a Comment